
Tradingview is a popular web platform and social network of technical and analytical orientation for traders and private investors. It was launched in the fall of 2011 as an open platform for the exchange of investment ideas.
Today Tradingview offers users an extensive list of diverse functionality, a special place is occupied by graphical analytics, trading indicators and recommendations, as well as a trading platform.
Most TradingView tools are available for free, but there are several options for a paid subscription with more functionality. The number of users monthly visiting the site of this service today exceeds 8 million people.
- What is TradingView
- Tradingview Key Features
- How to Use TradingView
- Tradingview Charts
- Tradingview Reviews
What is TradingView

TradingView is a renowned provider of interactive charts and detailed analytics on trading assets — cryptocurrency, stock, financial, all kinds of indices, futures, etc. In addition, TradingView is also a social network for traders with the possibility of subscribing to each other, exchanging messages and publishing forecasts accompanied by graphs of changes in the rate of assets.
Today, the Tradingview website is available in more than 15 languages and contains a lot of useful functionality, which is rather difficult to understand without detailed instructions, especially when it comes to a novice trader.
TradingView official website
Tradingview Key Features

Despite the fact that most trading floors have their own charts that reflect the situation with trading pairs of domestic markets, most often their capabilities are significantly limited. At best, they can offer a small set of technical indicators and the ability to customize the timeframe.
But, since this is clearly not enough for a full analysis of the markets, the choice of many traders falls on the Tradingview service, in the arsenal of which, in addition to the points already mentioned, there are:
Customizable notifications about events in the marke
The above list is far from complete, but contains the most popular tools of the Tradingview platform, which we will now consider.
How to Use TradingView

How to use Tradingview:
- Go to the official TradingView website.
- In the Main menu, select one of the Tradingview sections (ideas, markets, screener, charts, etc.) and use the functionality available in it.
- If necessary, enter the ticker of a specific asset in the search line (to view the chart, trading ideas and recommendations).
- Go to the graphical analytics section to gain access to the extensive tradingview toolbox.
Read more about working with the Tradingview platform in a further review.
Despite the fact that the Tradingview website is open to unregistered users, it is still recommended to create your own, even free account, to get rid of numerous restrictions.
Registration on Tradingview

How to register at TradingView:
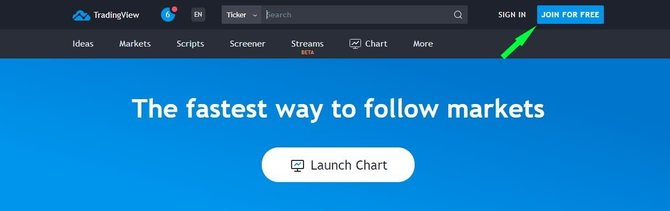
- Click on the “Register” button.
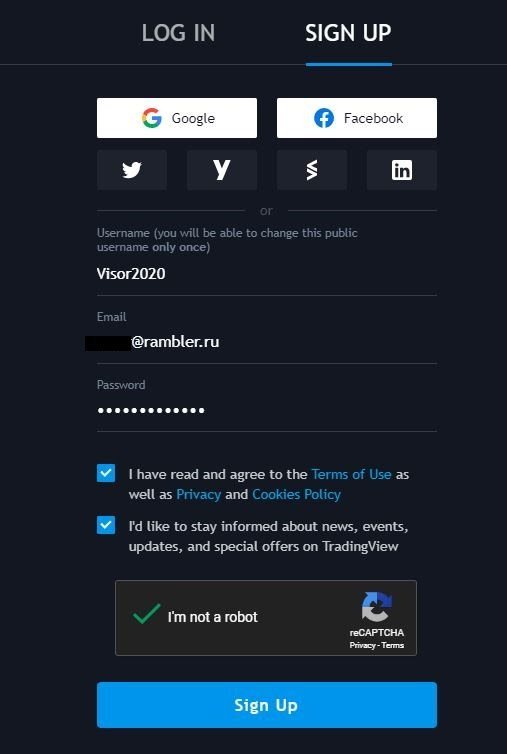
- Fill out the form by entering an email and having a password.
- Confirm that you are not a robot.
- Follow the link in the email sent by Tradingview.
To register on the TradingView platform, you need to fill out a simple form, which is called up using the “Register” button located in the website header.
All you need to specify is a username, email address and password. You also need to put a “daw” in the line of agreement with the Terms of Use of the service and confirm that you are “not a robot”. In addition, you can register by logging into the account of one of the listed social networks.
The activation of the created Tradingview account is carried out by clicking on the link contained in the letter sent by the Tradingview. After that, you can enter the platform website using the login and password specified during registration.
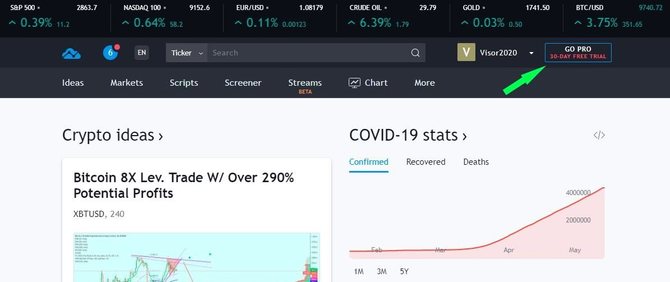
And it’s worth taking advantage of this opportunity, as paid TradingView subscriptions provide a number of advantages:
You can get free of charge any of the available TradingView tariff plans, which differ in cost and functionality.
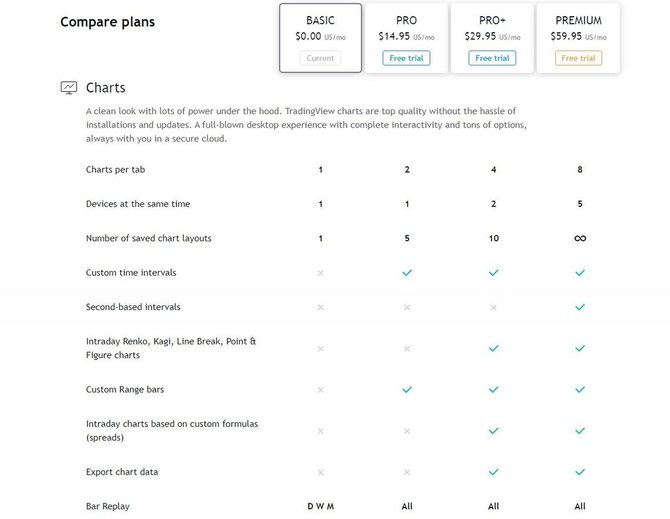
To do this, you will have to indicate your payment details (card or PayPal account) and agree with the monthly payment of the cost of the selected tariff. It is indicated that the first payment will be charged only after a month, and the subscription can be canceled at any time.
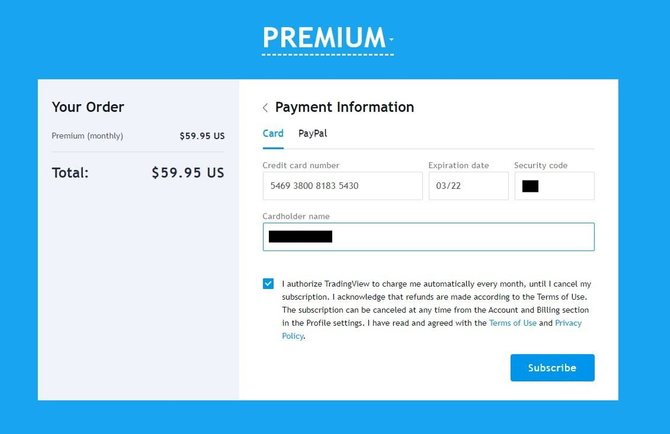
Thus, the user gets the opportunity to test all the functionality of TradingView for free for 30 days.
TradingView Website Interface

The design of the Tradingview website cannot be called minimalistic, as it is quite saturated with all kinds of menus, buttons and various areas with text and graphic data.
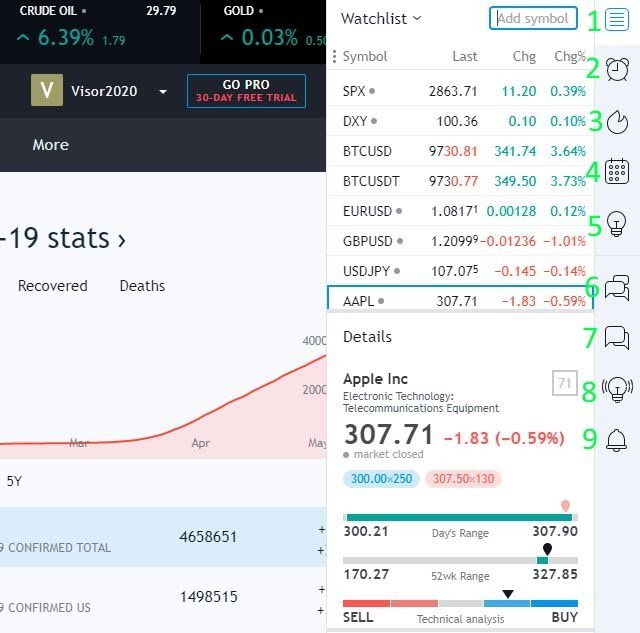
At the very top of the Tradingview website, quotes of the six most popular market assets are displayed. Immediately below them is a panel with the TradingView logo, “What's New” buttons (platform news), a menu for choosing an interface language and a search form.
At the end of the same line is a drop-down menu titled with a username. Through it, you can go to settings and profile data, financial information, statistics on referrals, subscribers and published ideas. There is also a switch that allows you to activate the dark theme of the Tradingview website interface.

On the right side of the Tradingview website, there is a fixed panel on which the contents of one of the tabs present on it is displayed:
Main Sections of the Platform
Access to all the main functionality of Tradingview is carried out through the main menu of the site, located in the header of the site.
Ideas
A section containing trading ideas, strategies and forecasts published by TradingView users. In addition, there may be educational materials on various tools for trading and market analysis.
Ideas can be filtered by the class of assets that they concern, as well as by the applied methodology (trend and wave analysis, harmonic and graphic patterns, indicators).
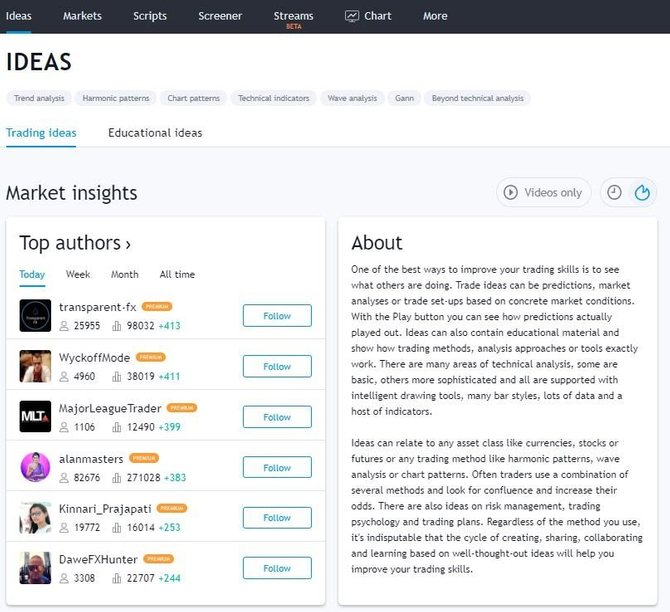
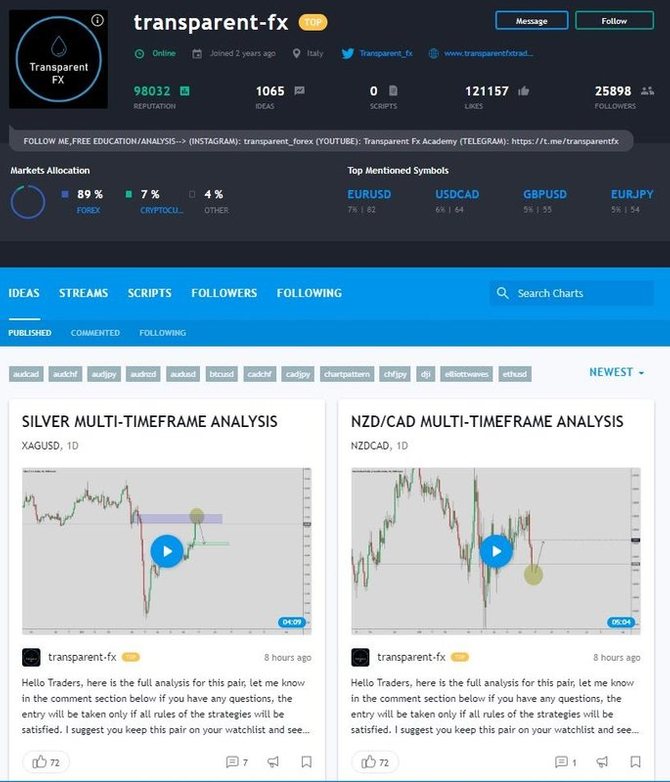
At the top of the page with ideas, the rating of the most popular authors of Tradingview for different time periods is always displayed. If you click on the name of the users in this rating or in the description of any post published in the section, you can see the publicly available data of his profile (reputation, number of ideas, likes and subscribers), and the entire stream of its predictions.
This may be required to understand the level of competence of the author as a market analyst and, as a consequence, the likelihood of making its predictions. Ideas can be liked, commented on and reposted on Twitter, Facebook, StockTwits or embed as code on any website, blog or forum. You can subscribe to authors.
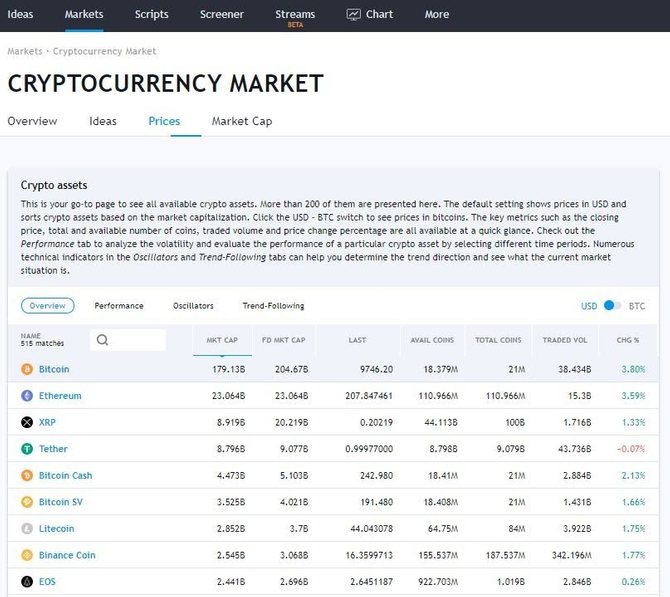
Markets
A menu that gives users access to online data on all platforms monitored by the platform: cryptocurrencies, stocks, indices, currencies, futures and bonds.
For example, if you select “Cryptocurrencies” in the drop-down menu, a page opens with a list of crypto assets sorted by capitalization, indicating prices, trading volumes, changes in value, number of coins in circulation, etc. (by rating type CoinMarketCap).
Using the available tabs, you can switch to trading ideas and predictions for cryptocurrencies, as well as global capitalization charts.
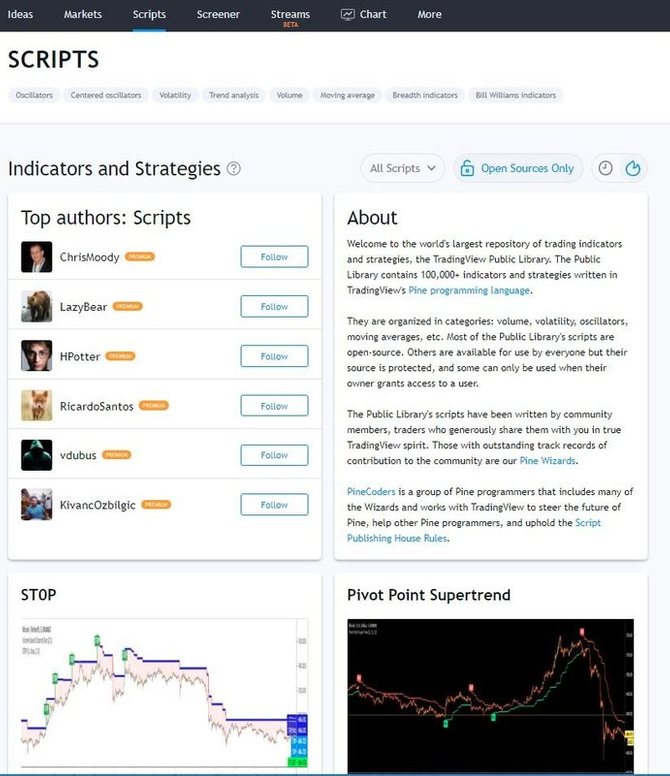
Scripts
The Tradingview drop-down menu allows you to view scripts by category, in which they are grouped by common features (oscillators, volumes, volatility, moving averages, market width indicators, etc.). They can be sorted by type (indicator or strategy), as well as by novelty and popularity.
When choosing any script, a window opens with a detailed description, source code and instructions for use. To use them, you need to go to the trading analytics section of TradingView and find by name through the corresponding functionality.
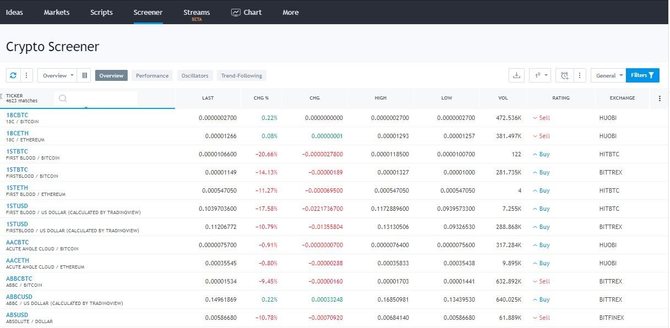
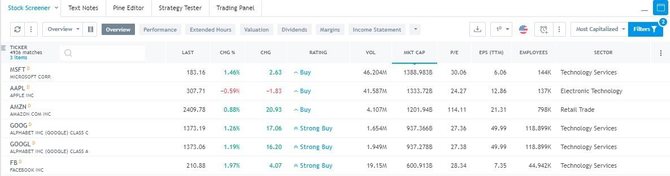
Screener
Allows you to view a list of market assets sorted by any parameter (growth, oversold, capitalization, volatility, etc.). Tradingview offers three options for this tool — for stocks, Forex and cryptocurrencies.
The table of the screener displays the price of the asset, the percentage of its change, the minimum and maximum value for the period under review, trading volumes, the current rating for oscillators, as well as the data source platform.
By default, the list is updated automatically in real time, but can also be configured to manually check positions. In addition, the Tradingview screener can display the status of trading pairs by price dynamics for different time periods, data from oscillators and trend lines.
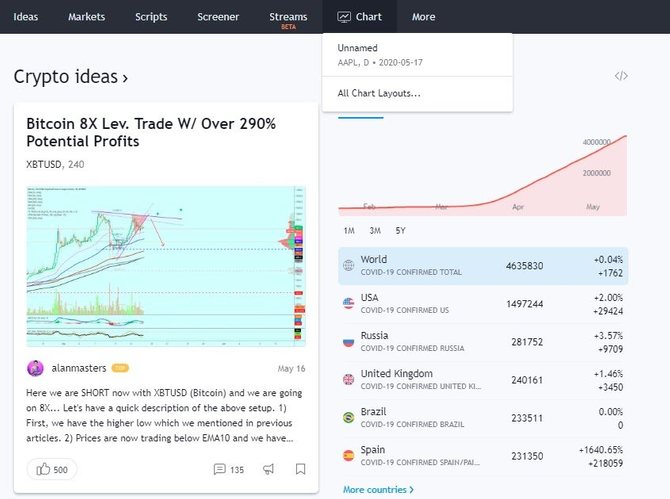
Chart
When you hover over this menu, a list of trading views previously saved by the user is displayed. If you click on one of them or directly on the title link, the TradingView interactive zone with graphical analytics tools will open (more in the next section).
More
Through this menu, you can go to the “Show” section, which contains videos describing the platform’s tools, reviews of market events, trading ideas, interviews with famous traders and other informative videos.
It also contains all the information about Tradingview (description, features, prices, conditions of the referral program, user behavior rules, help center, blog) and links to solutions for websites, brokers and advertisers.

Tradingview Charts
This section of TradingView should be given special attention, since it is in it that most of the tools available on the platform for graphical analytics, as well as the creation and testing of trading strategies, ideas and indicators, are concentrated.
The interface of the chart section is significantly different from other Tradingview pages. There is no website header and main menu. Most of the screen is occupied by an interactive workspace. In its upper part, the name of the trading pair, the current timeframe, the name of the data source area, the construction style (bars, candles, etc.) and the list of indicators used (1) are given.
Also, somewhere at the top of the Tradingview website there is usually a floating panel with the "Sell" and "Buy" buttons, which is used to trade through a broker account connected to TradingView (2). If it interferes, you can turn off its display by calling the context menu with a right-click.
Under the chart are areas of indicators and strategies that cannot be directly applied to it (3). Even lower, under the scale, there is a functional for changing the period duration, as well as the “Go to ...” menu for moving to a specific point in time in the asset’s history (4). At the end of the same line there are buttons for switching on the percentage and logarithmic scales, as well as for automatic scaling (5).

In the right part of the graphical analytics window there is a column with quotes, notifications, chats and other elements that have already been described above in the section on the interface of the TradingView website. But the other three panels framing the chart above, left and bottom, need to be considered in more detail.
Top Panel

The functional area located above the graph contains diverse buttons and drop-down menus:
- A field for entering a trading pair, the chart of which the user wishes to load. Here you need to start entering the first letters of the asset ticker to see the available options from different platforms supported by Tradingview.
- Timeframe (seconds, minutes, hours, days, etc.) — used to scale and detail the chart. In the free version, you can use only part of the standard options offered by the system Holders of paid subscriptions can add their own options for the base time intervals.
- Type of construction — allows you to choose the display option: bars, Japanese and empty candles, line, base area, tic-tac-toe, Kagi, Range, Renko and linear breakthrough.
- Adding charts of other assets to compare with the current. You can choose options related to other markets. For example — to put the gold rate (XAU / USD) on the bitcoin chart (BTC / USD).
- A tool for adding built-in indicators and TradingView strategies, as well as published by users.
- Fundamental data for the stock market.
- Template indicators are sets of several indicators based on common parameters (oscillators, volumes, EMA, etc.).
- Creating an alert — the tool allows you to set the alarm for certain events with the movement of the chart in the future (price crossing, entering the channel, changing by n%, etc.). Notifications can be displayed directly in the browser (in several versions) or sent by email.
- Setting the schedule update rate (from 0.1 to 5 seconds).
- Buttons for canceling or returning the performed actions.
- The choice of location scheme — for paid subscriptions with the ability to work with multiple charts in one window.
- Menu of general actions with the schedule (saving in the cloud, renaming, creating a new one, loading previously saved ones).
- Settings — changing the parameters of the visual display of the chart, scales, workspace, trading options, lines with details of the indicators used, etc.
- Enabling TradingView full screen charts (to exit it, you need to press Esc on the keyboard).
- Take a screenshot (the same thing is done using the keyboard shortcut Alt + S).
- Publication of your ideas in the corresponding section of Tradingview.
- Record a video idea.
Drawing Panel
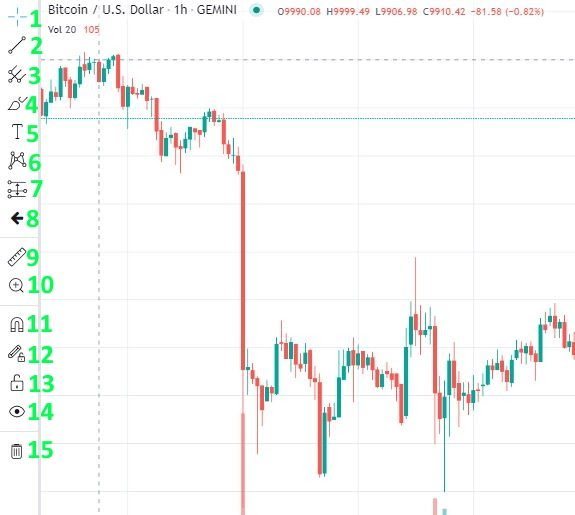
Located on the left side of the workspace and contains a wide selection of tools for drawing and drawing ready-made technical templates on the chart:
- Select the type of cursor (crosshair, point, arrow, eraser).
- Trend Lines — a menu for selecting the simplest drawing tools (trend line and angle, ray, arrow, straight line, parallel channels, etc.).
- Technical analysis tools — various figures (pitchforks, fans, squares, circles, spirals, etc.), including well-known traders Gunn, Shifa and Fibonacci.
- Geometric shapes — a set for drawing on the graph ellipses, rectangles, broken lines, etc.
- Commenting tools — add text, footnotes and notes to the screen.
- Patterns — drawing on the chart of popular geometric and wave patterns.
- Measurement and Prediction Tools — calculation of price and time ranges, risk and profit ratio for long and short positions, forecasting further course movement, using bar templates and price projections.
- Icons — drawing on the chart of various popular pictograms (arrows, jackdaws, hammers, rockets, etc.).
- A ruler for measuring the duration of selected ranges and the percentage change in price between horizontal levels.
- Scale — approximation of selected fragments.
- Magnet is a tool for linking graphic elements to a price chart.
- Stay in drawing mode.
- Fix all — makes it impossible to move all the objects plotted on the chart.
- Hide — makes all drawn elements invisible.
- Deletion (of graphic objects, indicators, or in general everything that has been plotted on the chart).
The Bottom Panel

The panel located below the TradingView chart offers additional functionality that can be useful to active traders and analysts:
- Screener (1) - allows you to view rating statistics on assets (cryptocurrencies, Forex, stocks) in parallel with the work in the chart window. In fact, this is a slightly truncated version of the same section, available from the main menu of the Tradingview website.
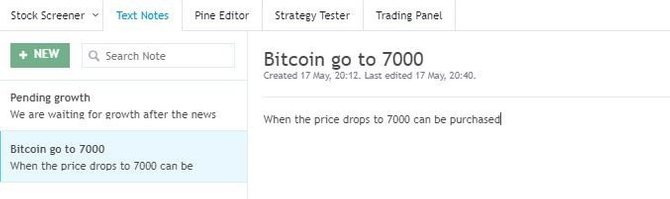
- Notes (2) — a simple tool for recording thoughts while working with charts.
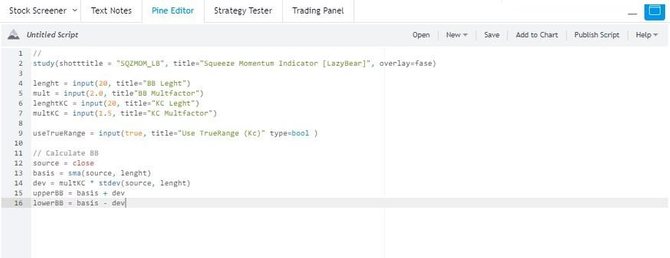
- The Pine Editor (3) is a full-fledged script editor that can be used to create your own strategies and indicators and then publish them on TradingView.
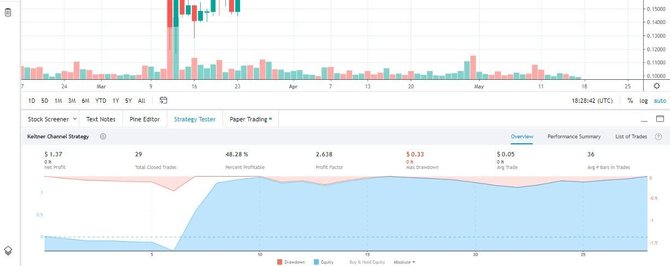
- Strategy Tester (4) — a tool for checking the operation of the strategy used on the chart. Shows a list of transactions made with its help and a summary of their effectiveness.
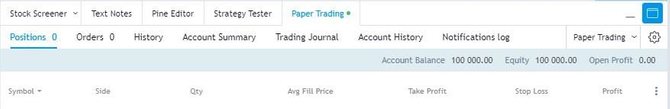
- Trading panel (5) — allows you to train in trading assets, the graphs of which are viewed by the user, using a demo account with $ 100,000 on the balance sheet. You can also connect an account of one of the supported platforms to make real transactions without leaving Tradingview.
Using the buttons located on the right side of the panel (6 and 7), you can collapse and expand the working space of the listed tools, including the entire graphic area.
Interaction with Tradingview Charts

General principles of interaction with TradingView charts:
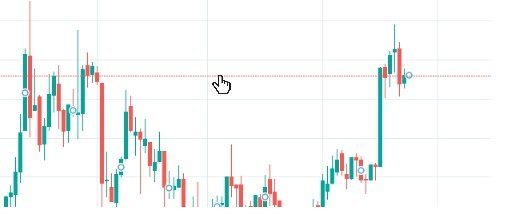
- Moving along the timeline is carried out using the Hand tool, which appears when you hold the cursor anywhere in the graph. You can also scroll the picture left and right using the arrow buttons.
The chart scale can be changed in several ways:
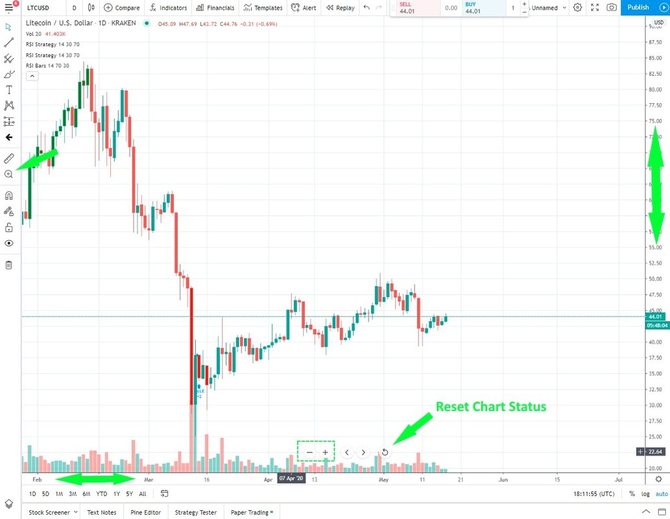
- Reset graph chart (return to default scale) carried out through a button above the timeline or through the context menu, which is called by clicking the right mouse button anywhere in the workspace. Through it, you can delete all added indicators and strategies.
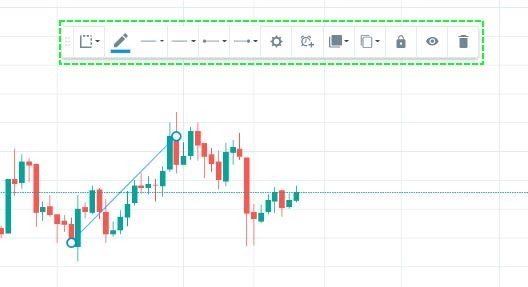
- When working with drawing tools, a floating panel appears on the chart with buttons that allow you to change the color and type of outline, edit the order of layers, copy and clone, hide, fix and delete objects, as well as create alarms at the intersection of drawn trend lines.
- When you hover over the line with the name of the indicator added to the chart, buttons appear that make it possible to hide, delete and configure it. The latter allows you to select options that differ from the default settings. Moreover, you can change both the style of visual display of the indicator and its technical parameters.

Otherwise, most of the functionality available for working with charts is intuitive for users who are at least broadly oriented in trading and analytics. Better knowledge may be required when using complex Gann and Fibonacci tools, as well as some technical indicators and strategies.
Tradingview Reviews

Most of the reviews on the TradingView platform found on the Internet indicate that users are very satisfied with it. And this is not at all surprising, given the quantity and quality of the provided Tradingview tools for analytics and trading.
Some are frustrated by the presence of paid subscriptions, although it is clarified that a free version is quite enough for a beginner.
There are also rave reviews from users that any money spent on a subscription will definitely return as a result of using the tools provided by the platform.
As for the negative reviews about TradingView, it was possible to find only a mention of the unfair actions of the moderators. But to attribute such, most likely private, cases to the disadvantages of the Tradingview platform is clearly not worth it — if there was a real problem, there would be much more such complaints. And some more indicate that the site design has not been updated for a long time, but otherwise the service works fine, so they still give it five stars.
So TradingView can undoubtedly be called one of the best existing platforms for traders and analysts who need an extensive set of customizable tools for working with charts.
Binomo: Entrance, Reviews, How to Trade